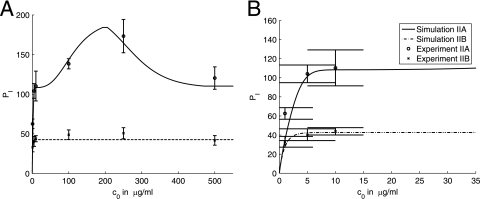
FIG. 8.
Comparison of the model simulations and experimental results presented in Fig. 4B. Panels A and B present the same data and simulations but using different scales. The same legend applies to both panels. Error bars represent standard deviations. Summaries of experimental conditions and simulation parameters are given in Tables 4 and 5.

