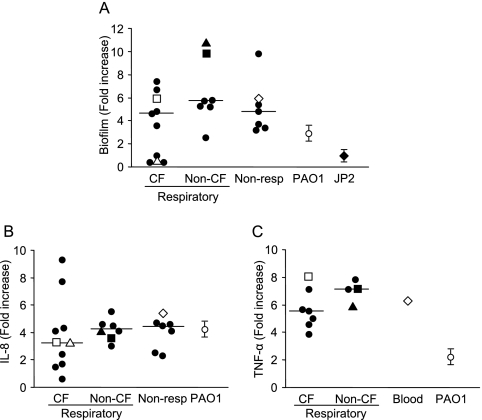
FIG. 1.
Biofilm production and chemokine-cytokine induction by S. maltophilia. (A) Amounts of biofilm produced by S. maltophilia isolates and P. aeruginosa (PAO1) expressed as fold increases compared to the biofilm produced by the PAO1 lasI rhl mutant (JP2). Each symbol represents an individual S. maltophilia isolate, and the median values are indicated by lines. □, CF1; ▵, CF2; ▪, N1; ▴, N2; ⋄, N3. (B) Levels of IL-8 determined by ELISA after stimulation of 1HAEo− cells for 1 h with S. maltophilia or P. aeruginosa PAO1. The IL-8 levels are expressed as fold increases compared to the IL-8 levels in unstimulated cells. Each symbol represents an individual S. maltophilia isolate, and the median values are indicated by lines. □, CF1; ▵, CF2; ▪, N1; ▴, N2; ⋄, N3. (C) Levels of TNF-α production determined by ELISA after stimulation of RAW cells for 4 h with 100 ng of lipid A from S. maltophilia or P. aeruginosa PAO1. The results are expressed as fold increases in TNF-α production compared to the production by unstimulated cells. Each symbol represents an individual S. maltophilia isolate, and the median values are indicated by lines. □, CF1; ▪, N1; ▴, N2; ⋄ N3.

