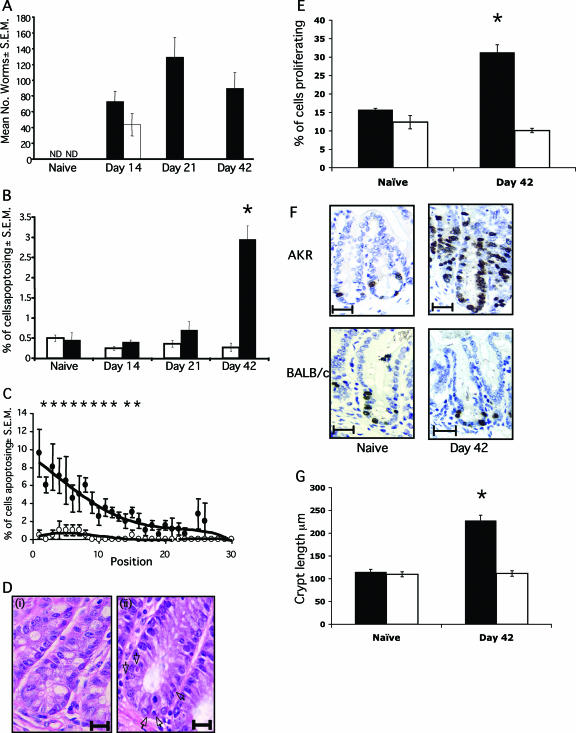
FIG. 1.
Levels of apoptosis during T. muris infection. (A) AKR (▪) and BALB/c (□) mice were infected with 200 T. muris eggs by oral gavage. Worm burdens were assessed at various time points postinfection. ND, not detected. (B) The levels of apoptosis were assessed at days 14, 21, and 42 p.i. in AKR (▪) and BALB/c (□) mice. Apoptotic cells were identified by their morphology on sections stained with hematoxylin and eosin. Four mice per group were scored, with 50 crypts per mouse. (C) Location of epithelial cells within the crypt. The percentage of cells apoptosing at each position was assessed. Symbols: •, AKR mice; ○, BALB/c mice. A “0” value is the base of the crypt, and “30” is the lumen. (Di) Absence of apoptosing cells in naive AKR cecum. Scale bar, 20 μm. (Dii) Apoptosing cells in AKR ceca at day 42 p.i. (black arrows). Scale bar, 15 μm. (E) Epithelial cell proliferation was assessed by BrdU incorporation in AKR mice (▪) and BALB/c mice (□). (F) Histology of BrdU staining in the cecal epithelium. Scale bar, 30 μm. BrdU-positive cells are stained brown. (G) Crypt length in AKR (▪) and BALB/c (□) mice. Each datum point represents the mean of four animals ± the standard error of the mean (SEM). *, the Student t test showed a statistically significant increase in AKR mice versus BALB/c mice (P < 0.001).

