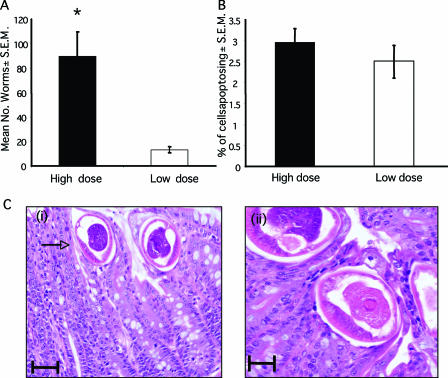
FIG. 2.
Apoptosis during low-dose T. muris infection. AKR mice were given either a low-dose (□) T. muris infection (25 eggs) or a high-dose (▪) infection (200 eggs). (A) Worm burdens were assessed at day 42 p.i. (B) Apoptosis levels were assessed at day 42 p.i. Each bar represents the mean of four animals ± the S.E.M. *, the Student t test reveals a statistically significant difference between the two groups (P < 0.001). (Ci) Mature worms in epithelial tunnel at day 42 p.i. The arrow indicates the anterior end. Scale bar, 50 μm. (Cii) Image of worm showing epithelial tunnel surrounding the parasite, along with an absence of apoptosing cells in close proximity. Scale bar, 25 μm.

