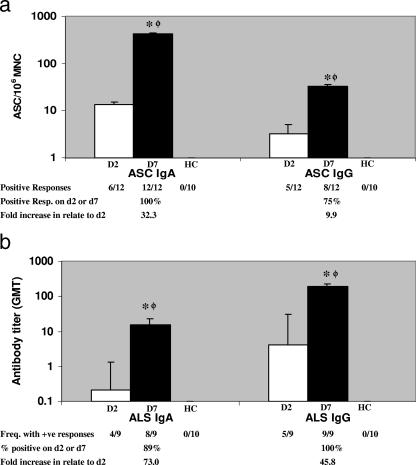
FIG. 1.
(a) IgA and IgG ASC responses to CS6 antigen in adult patients infected with CS6-expressing ETEC. The responses to CS6 after the onset of diarrhea at the acute stage (day 2 [D2]) and at the early convalescence stage (day 7 [D7]) are shown, as are the responses in adult healthy controls (HC). The response frequency indicates the number of patients responding with ≥10 ASC/106 PBMC in all the patients studied. The bars indicate geometric means, and the error bars indicate standard errors of the means. Asterisks indicate statistically significant differences (one asterisk, P < 0.05 to 0.01; two asterisks, P < 0.01 to 0.001; three asterisks, P < 0.001) at day 7 compared to the responses at day 2. Phi indicates that there was a significant difference between patients at day 7 and healthy controls (P < 0.001). MNC, peripheral blood mononuclear cells. (b) IgA and IgG antibody responses to CS6 antigen in ALS specimens from adult patients with CS6-expressing ETEC. The responses to CS6 after the onset of acute-stage diarrhea (day 2 [D2]) and at the early convalescence stage (day 7 [D7]) are shown, as are the responses in adult healthy controls (HC). The response frequency indicates the number of patients responding with titers of ≥2/107 PBMC for all patients studied. The bars indicate geometric mean titers (GMT), and the error bars indicate standard errors of the means. Asterisks indicate statistically significant differences (one asterisk, P < 0.05 to 0.01; two asterisks, P < 0.01 to 0.001; three asterisks, P < 0.001) at day 7 compared to the responses at day 2. Phi indicates that there was a significant difference between patients at day 7 and healthy controls (P < 0.001). +ve, positive.

