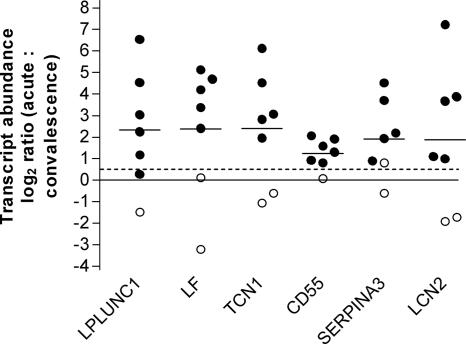
FIG. 1.
Differentially expressed genes during acute cholera compared to convalescence, expressed as log2 ratios determined by RT-PCR. The horizontal lines indicate means. The circles represent measurements for patients with (filled circles) and without (open circles) up-regulation, as determined by the microarray technique using an acute-phase/convalescent-phase log2 ratio of >0.5 to define individual up-regulation. The dashed line indicates the individual threshold value used during the microarray screening.

