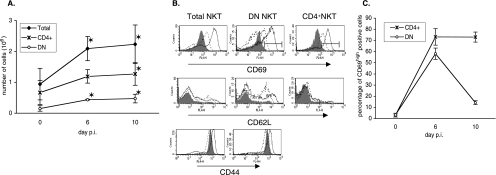
FIG. 1.
Kinetic and surface phenotype of hepatic NKT cells during primary P. yoelii infection in C57BL/6 mice. (A) Numbers of total, CD4+, and DN NKT cells in the livers of B6 mice on day 0 (noninfected) and days 6 and 10 after injection of 4,000 sporozoites. Hepatic cells were stained with anti-NK1.1, -TCRβ, -CD4, or -CD4+ CD8 mAbs, and the numbers of total (NK1.1+ TCRβ+), DN (CD4− CD8− NK1.1+ TCRβ+), and CD4+ (CD4+ NK1.1+ TCRβ+) NKT cells were determined by flow cytometry analysis. Data are representative of three different experiments with at least three mice per time point. Results are expressed as mean values ± SD. (B) Markers expressed by hepatic NKT cells in noninfected mice (day 0, filled histogram) and infected mice at day 6 (thin line) and day 10 (dotted line) after injection of 4,000 sporozoites. Hepatic cells were stained with anti-NK1.1, -TCRβ, -CD4, or -CD4+ CD8 mAbs and anti-CD69, -CD62L, or -CD44 mAbs. Histograms are gated on total, DN, and CD4+ NKT cells as defined in A. Data are representative of two independent experiments with three mice per time point. (C) Percentages of CD69high cells among CD4+ and DN NKT cells (gates were down as shown in panel B). This is a different representation of the results shown in B, and results are expressed as mean values ± SD. *, the P value was <0.05 between control (day 0) and infected animals.

