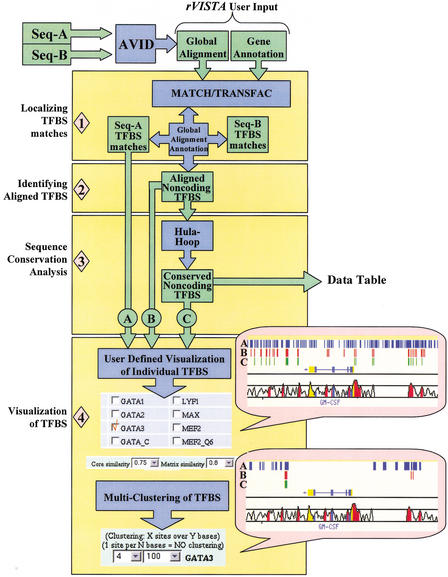
Figure 1.
rVISTA data flow. The user submits a global alignment file (generated by the AVID program) and optional annotation files for the two orthologous sequences. The imported TRANSFAC matrix library and the MATCH program are consequently used to identify all transcription factor binding site (TFBS) matches in each individual sequence and to generate a file with all TFBS matches in the reference sequence (used as baseline for visualization). Next, the global alignment and the sequence annotations provided are used to identify all aligned TFBSs present in the noncoding DNA (in the absence of annotation, the program will identify all aligned sites across the entire alignment). A second file is generated containing aligned noncoding TFBSs. DNA sequence conservation is determined by the hula-hoop module, which identifies TFBSs surrounded by conserved sequences and generates a data table with detailed statistics. The final data processing step includes a user-interactive visualization module. The user customizes the data by choosing which TF sites to visualize (we are giving an example for choosing GATA-3 sites), what TRANSFAC parameters to use for all TF matches (rVISTA default 0.75/0.8), and by selectively clustering individual or combinatorial sites. The user can customize the clustering of any of the three data sets (all matches in the reference sequence are depicted as blue tick marks, aligned TFBS matches are in red, and conserved TFBS matches are in green).

