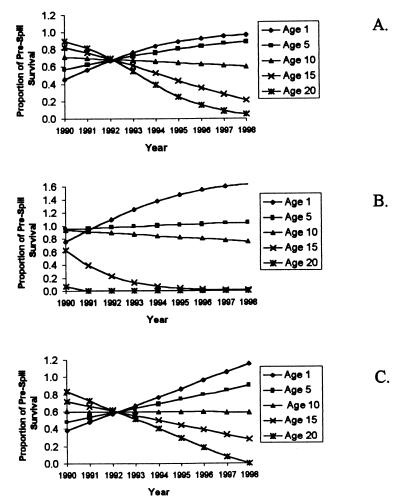
Figure 2.
Estimated postspill effects on age-specific survival rates. Estimated effects on survival rates are shown as proportions of prespill (baseline) rates for five representative ages. Shown are best-fit results for the logistic model (A), the modified logistic model (B), and the linear model (C).

