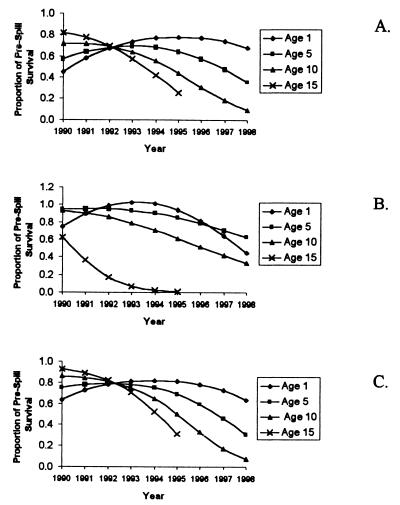
Figure 3.
Changing postspill effects for cohorts of otters. Each line represents annual survivals experienced each year for an aging group of otters that were 1, 5, 10, or 15 yr old at the time of the 1989 spill, expressed as a proportion of prespill survival rates. Shown are best-fit results for the logistic model (A), the modified logistic model (B), and the linear model (C).

