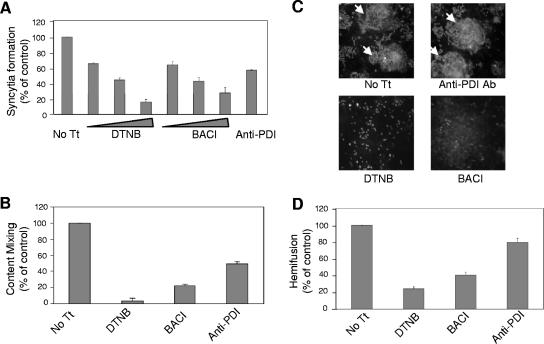
FIG. 3.
Effects of PDI inhibitors on cell-cell fusion. (A) Syncytium formation in the presence of DTNB (2.5 mM, 5 mM, or 7.5 mM), bacitracin (BACI) (2.5 mM, 5 mM, or 7.5 mM), or anti-PDI antibody (6 μl/ml) was quantified as described in Materials and Methods. Inhibitors were added 24 h posttransfection, and at 48 h posttransfection, the average size of syncytia was determined. The results are expressed as percentages of the values obtained for untreated cells (No Tt) and are the averages of three independent experiments, with the error bars indicating standard deviations. (B) Effects of DTNB (7.5 mM), bacitracin (BACI) (7.5 mM), or anti-PDI antibody (6 μl/ml) on content mixing were assayed using a β-galactosidase reporter assay. Effector cells cotransfected with HN and F protein cDNAs, as well as pTA, were treated with inhibitors or left untreated. Treated or untreated target cells, transfected with pB1-G only, were overlaid onto HN and F protein-expressing cells. Content mixing between effector and target cells was quantified by measuring β-galactosidase in cell extracts and is shown as a percentage of the activity detected in untreated cells (No Tt). The results are the averages of three independent experiments, and the error bars indicate standard deviations. (C and D) The effects of DTNB (7.5 mM), bacitracin (BACI) (7.5 mM), or anti-PDI antibody (6 μl/ml) on lipid mixing were assayed in COS-7 cells transfected with HN and F protein cDNAs. At 24 h posttransfection, the inhibitors were added to the cells, and at 48 h posttransfection, the cells were incubated with R18-labeled RBCs on ice, followed by incubation at 37°C for 40 min. The cells were visualized with a fluorescence microscope for dye transfer (C). Cells with positive dye transfer are indicated by arrows. The average numbers of cells with positive dye transfer per field were determined and are represented as percentages of the values determined for untreated cells (No Tt) (D). The results are the averages of three different experiments, and the error bars represent standard deviations.

