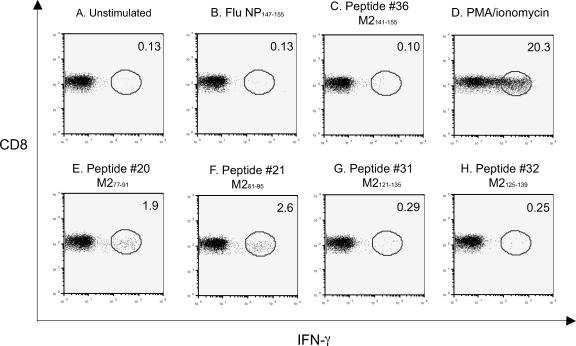
FIG. 2.
Analysis of peptide-reactive CD8+ T lymphocytes 48 days after a second infection. Splenocytes were incubated in the presence or absence of the peptides (1 μg/sample) in an intracellular cytokine staining assay for IFN-γ. The dot plots represent the production of IFN-γ from one of three representative experiments with similar results. Panels A to C show results for negative control stimulations. Flu NP147-155, influenza virus protein NP147-155. Panel D shows results for a positive control for maximal stimulation. Panels E and F show results for stimulations with M282-90. Panels G and H show results for stimulations with M2127-135.

