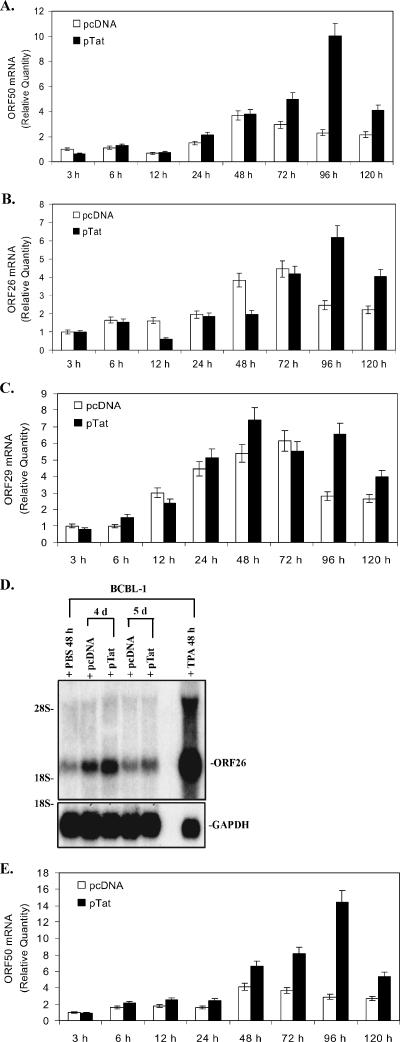
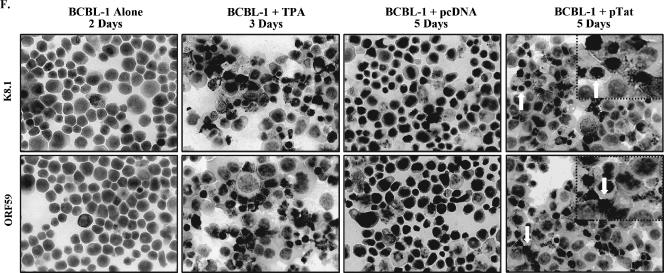
FIG. 2.
Expression of KSHV lytic cycle RNA and protein in PEL cell lines transfected with Tat. (A) ORF50 mRNA expressed in BCBL-1 cells following transfection with pTat. ORF50 mRNA expression in BCBL-1 cells transfected with pcDNA or pTat for 3, 6, 12, 24, 48, 72, 96, and 120 h was quantitated by real-time quantitative PCR. Relative quantities of ORF50 expression are represented on the y axis. Results shown were from five independent experiments performed in triplicate. (B) ORF26 mRNA expressed in BCBL-1 cells following transfection with pTat. ORF26 mRNA expression in BCBL-1 cells transfected with pcDNA or pTat for 3, 6, 12, 24, 48, 72, 96, and 120 h was quantitated by real-time quantitative PCR. Relative quantities of ORF26 expression are represented on the y axis. Results shown are from five independent experiments performed in triplicate. (C) ORF29 mRNA expressed in BCBL-1 cells following transfection with pTat. ORF29 mRNA expression in BCBL-1 cells transfected with pcDNA or pTat for 3, 6, 12, 24, 48, 72, 96, and 120 h was quantitated by real-time quantitative PCR. Relative quantities of ORF29 expression are represented on the y axis. Results shown are from five independent experiments performed in triplicate. (D) Northern blot analysis for ORF26 mRNA expressed in BCBL-1 cells following transfection with pTat. Total RNA isolated from BCBL-1 cells treated with PBS (negative control) and TPA (positive control) for 48 h, from BCBL-1 cells transfected with pcDNA for 4 and 5 days (pcDNA 4 d and 5 d, respectively), and from BCBL-1 cells transfected with pTat for 4 and 5 days (pTat 4 d and 5 d, respectively) were transferred to a nylon membrane, and ORF26 mRNA expression was detected by Northern blotting. The same membrane was stripped and reprobed for glyceraldehyde-3-phosphate dehydrogenase (GAPDH) to demonstrate equal loading of the RNA. Results shown are a representative experiment of at least two independent experiments with similar results. (E) ORF50 mRNA expressed in BC-3 cells following transfection with pTat. ORF50 mRNA in BC-3 cells transfected with pcDNA or pTat for 3, 6, 12, 24, 48, 72, 96, and 120 h was quantitated by real-time quantitative PCR. Relative quantities of ORF50 expression are represented on the y axis. Results shown are from five independent experiments performed in triplicate. (F) Immunohistochemical staining of BCBL-1 cells transfected with pTat (original magnification, × 60). Expression levels of KSHV lytic proteins ORF K8.1 (top panel) and ORF59 (bottom panel) in BCBL-1 cells (negative control; BCBL-1 alone), TPA-treated BCBL-1 cells (positive control; BCBL-1 + TPA), BCBL-1 cells transfected with pcDNA (BCBL-1 + pcDNA), and BCBL-1 cells transfected with pTat (BCBL-1 + pTat) were detected by immunohistochemistry with ORF K8.1 and ORF59 monoclonal antibodies. The lighter-shaded reaction product signifies positive detection of the specified antigen. Arrows highlight examples of positive cells.


