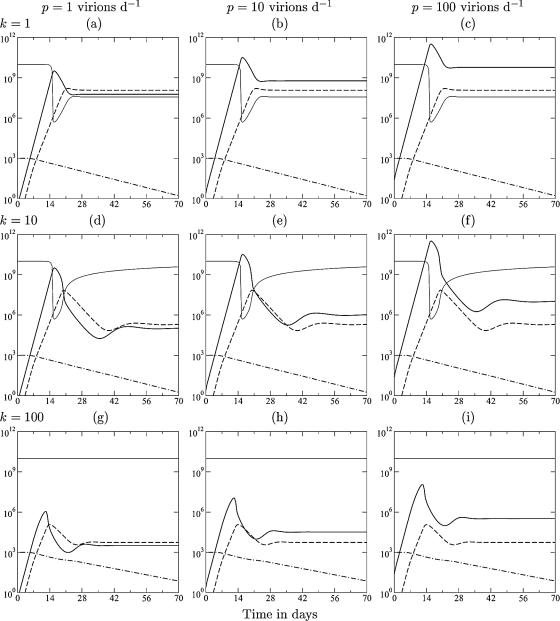
FIG. 1.
Acute infection dynamics in the model described in THEORY. The lines depict the target cells (T) (light solid line), the viral load (V) (heavy solid line), the immune response (E) (dashed line), and the naive T cells (N) (dashed-dotted line). From left to right, the production rate varies from p = 1 to p = 10 to p = 100 virions day−1 (and hence, β = 6.3, 0.63, and 0.063, respectively). From top to bottom, the killing rate varies from k = 1 to k = 10 to k = 100 day−1. Other parameters are as follows: γ = δ = 1 day−1, σ = 108 cells day−1, dT = 0.01 day−1, d = 0.02 day−1, dE = 0.5 day−1, m = 1.5 day−1, ha = hm = 1,000 cells, hk = 105 cells, hβ = 108 cells, and a = 0.1 day−1.

