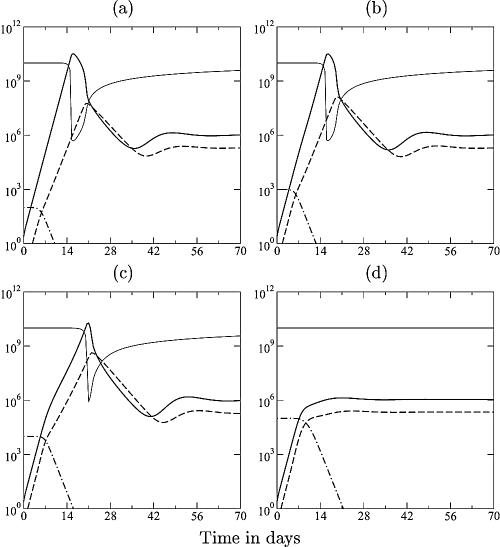
FIG. 2.
SIV dynamics in vaccinated monkeys. The lines depict the target cells (T) (light solid line), the viral load (V) (heavy solid line), the immune response (E) (dashed line), and the memory T cells (N) (dashed-dotted line). By increasing the activation rate 10-fold to a = 1 day−1, the naive T cells of equation 4 now represent memory T cells. In panels a to d, simulations start with various levels of memory cells, i.e., N1 = 102, 103, 104, and 105 cells, respectively. Other parameters are described in the legend of Fig. 1e, i.e., p = k = 10. Vaccination changes the initial infection dynamics only at high numbers of memory cells; otherwise, the response is too late and too slow and becomes important after the peak. Note that the peak viremia decreases somewhat from panel a to panel c and that the peak has disappeared in panel d. Because the model has only one attractor for these parameter values, the same viral set point is approached in all four panels. In reality, vaccinated animals approach lower set points.

