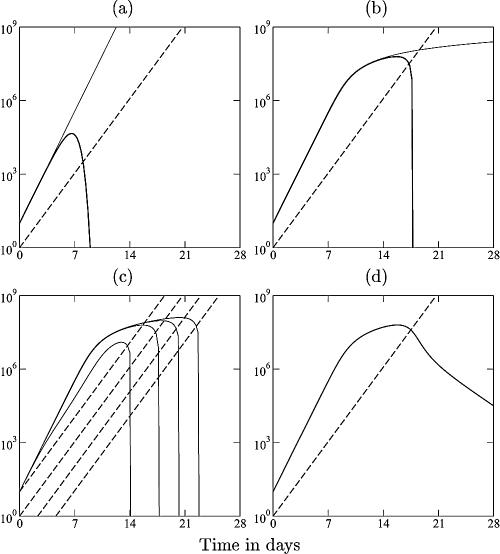
FIG. A1.
Cytotoxic immune response to an acute infection. Consider the model with density-dependent pathogen growth:
 |
of a pathogen, L, growing exponentially at a rate, r, as long as ɛL ≪ 1 (depicted by the solid line), and an immune response, E, growing exponentially at a rate of dE/dt = mE (depicted by the dashed line). For ɛ = cL = cE = 0, one obtains the mass-action model dL/dt = (r − k′E)L, where k′ = k/h. The heavy solid line in panel a shows that the pathogen growth drops to zero at the critical immune response E = r/k′. We take expansion rates that are realistic for SIV infection of macaques, i.e., r = 1.5 > m = 1 day−1 (21), and set k equal to 2 and h equal to 103 cells. The light solid line in panel a depicts uncontrolled pathogen growth that is obtained for the same parameters when we allow for saturation in the number of targets by setting cL equal to 1 (16, 26, 76). In panel b, the replication rate of the pathogen is reduced at high pathogen densities (by setting ɛ equal to 10−7 cells). The saturated immune response (with cL = 1) can eradicate the pathogen after its growth has slowed down. This model accounts for the observed limited effects of prophylactic vaccination, because the initial replication rate of the pathogen remained unaffected by vaccination, and similar peak values were observed; see panel c, where we start with E = 0.01, 0.1, 1, or 10 effector cells at time point zero. After the peak dL/dt ≈ rL − kE, and because the effector population is very large, the rate at which the pathogen is cleared is unrealistically fast. This is unrealistic because there are many effector cells per target cell, each killing target cells at rate k. We solve this problem by setting cE equal to 1, which makes the killing also limited by the target cells (d). By setting the killing rate, k, equal to 2 day−1, the down slope in panel d approaches the observed invariant, r − k = −0.5 day−1.

