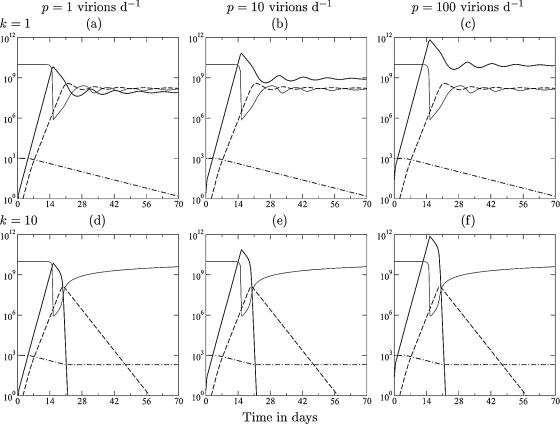
FIG. A2.
Acute infection dynamics without an eclipse phase. The effect of the eclipse phase on the down slope after the peak in viral load can be seen by comparing this figure with Fig. 1. The eclipse phase is eliminated from the model by increasing the maturation parameter, γ, by 100-fold and decreasing the death rate, δ, of virus-producing cells to keep the same expected life span of 2 days for productively infected cells. For low killing rates, k = 1 day−1, the immune response hardly affects the viral load, and there is hardly any down slope. For intermediate killing rates, k = 10 day−1, the down slope is much steeper than in the model with an eclipse phase, and the virus is eliminated after 3 weeks. Such a steep down slope and the clearance of the virus are unrealistic. The lines depict the target cells (T) (light solid line), the viral load (V) (heavy solid line), the immune response (E) (dashed line), and naive T cells (N) (dash-dotted line). Parameters are described in the legend of Fig. 1 but with γ = 100 day−1 and δ = 0.5 day−1.

