FIG. 2.
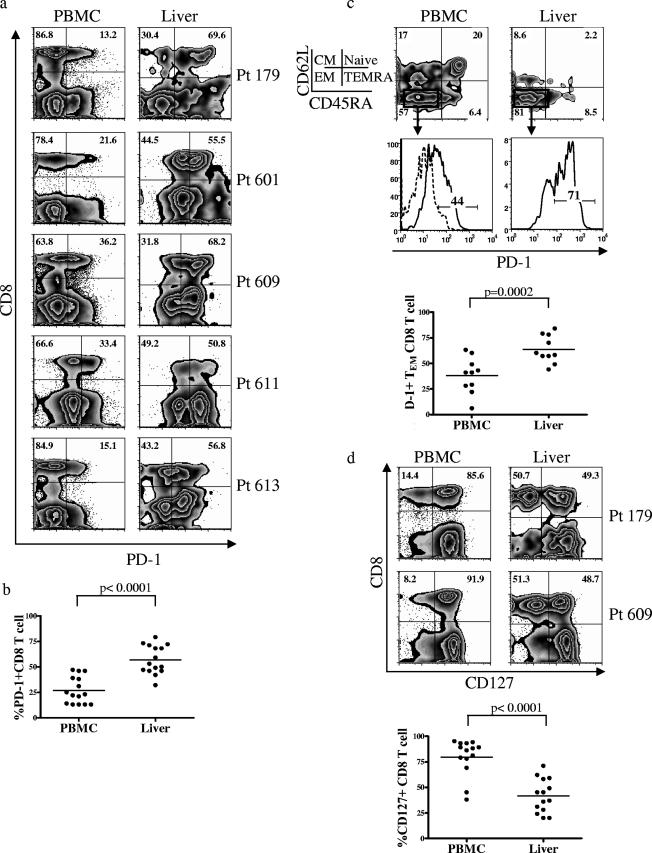
The frequency of PD-1-expressing CD8+ T cells in the liver is greater than in the peripheral blood. (a) Representative plots from five patients with chronic HCV infection, showing the expression of PD-1 on total CD8+ T cells from the peripheral blood versus the liver. Numbers in boldface within the plots identify the frequency of cells with PD-1 expression among total CD8+ T cells in the lymphocyte gate. Plots are on a logarithmic scale. (b) Comparison of PD-1 expression on CD8+ T cells from peripheral blood versus liver in chronically HCV-infected patients. A paired t test was used to compare the difference in PD-1 expression within the same patients. (c) Comparison of PD-1 expression on the CD8+ effector memory (TEM) cells from peripheral blood versus liver. Memory subsets were identified by differential expression of CD62L and CD45RA. Boldface numbers in the top plots represent the frequency of cells in each quadrant. Cells were gated on CD8+ lymphocytes. The TEM subset was gated (boxes), and the expression of PD-1 is shown in the histogram plots below. The dotted line shows PD-1 expression on naïve CD8+ T cells (used as the negative population). The numbers in the histogram plots represent the frequency of cells expressing PD-1. A comparison of the frequency of PD-1 expression on CD8+ TEM cells for 10 patients with chronic HCV infection is summarized below the histogram plots. A paired t test was used to compare the difference in PD-1 expression on CD8+ TEM cells from the peripheral blood versus the liver within the same patient. (d) Representative plots from two patients with chronic HCV infection, showing the difference in CD127 expression on total CD8+ T cells from the peripheral blood versus the liver. Numbers in boldface identify the frequency of CD127 expression on total CD8+ T cells. Cells were gated on CD8+ lymphocytes. Plots are on a logarithmic scale. A summary of the comparison of CD127 expression on total CD8+ T cells in the peripheral blood versus the liver is shown below the FACS plots. A paired t test was used for statistical analysis.

