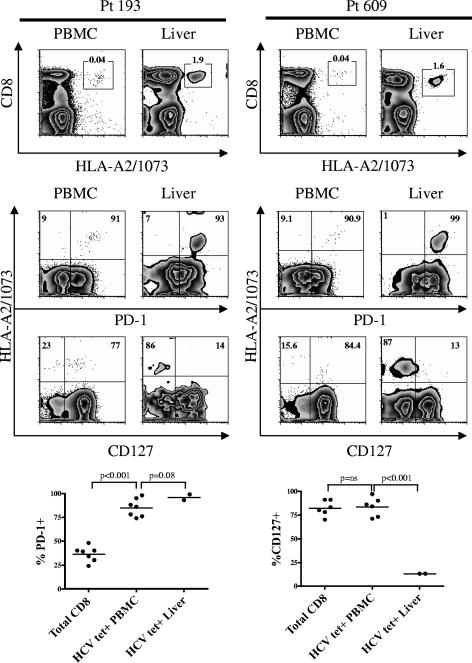
FIG. 3.
HCV-specific CD8+ T cells in the liver express an exhausted phenotype. Representative plots of PD-1 and CD127 expression on HCV-specific CD8+ T cells from the peripheral blood and the liver of two patients with chronic HCV infection are shown. The first row of plots identifies the HCV tetramer-positive population (boxes). The numbers above the boxes represent the frequency of tetramer-positive cells among CD3+ lymphocytes. The epitope specificity of the HCV tetramer is identified on the x axis (1073) for the first row of plots. The second and third rows of plots show PD-1 and CD127 expression on HCV-specific CD8+ T cells from the peripheral blood and liver of two patients with chronic HCV infection. Numbers in boldface represent the frequency of PD-1 or CD127 expression on HCV-specific CD8+ T cells. Plots are on a logarithmic scale and gated on CD3+ CD8+ lymphocytes. Below the FACS plots, a summary of the comparison of PD-1 expression (left) and CD127 expression (right) on total CD8+ T cells versus CD8+ HCV-specific T cells from the periphery (HCV tet+ PBMC) versus HCV specific CD8+ T cells from the liver (HCV tet+ Liver) is shown. Paired t tests were used to compare expression within the same patient.

