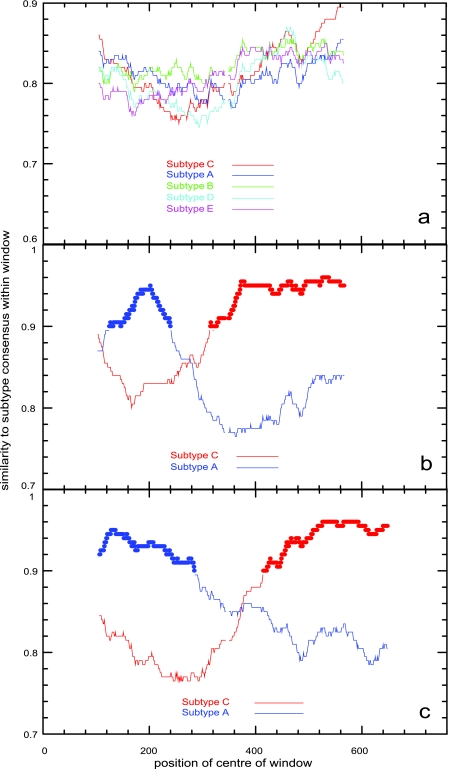
FIG. 2.
RIP graphical outputs of TKP21, a sequence from the “unknown” group (a); 214 (b) and 197 (c), two outlier sequences. The plots represent the distance between the query sequence and the subtype A (blue) or subtype C (red) reference sequence, over a sliding window of size 200 bp. In panels b and c, there is a clear point (the putative recombinant crossover point) at which the query sequences cease to be closer to A and become closer to C. In panel a, all five known subtypes are compared to the query sequence, with no significant similarity, although at the very end of the sequenced region there is some similarity to subtype C.

