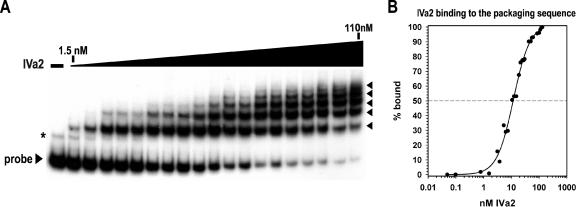
FIG. 6.
Multiple complexes form as IVa2 interacts with the packaging sequence. (A) Representative autoradiogram from an EMSA using a radiolabeled probe to nucleotide 200 to 397. The first lane lacks IVa2. The triangle above the lanes represents increasing concentrations of IVa2 (1.5, 3.1, 5.3, 6.3, 7.5, 10.6, 12.5, 15, 18.8, 21.3, 27.5, 30, 42.5, 50, 55, 60, 85, 100, and 110 nM). The IVa2-packaging sequence complexes are indicated with arrowheads. A nonspecific band that was consistently observed in the preparation of the complete packaging sequence probe is indicated with an asterisk. (B) Binding of IVa2 to the packaging sequence probe. The percentage of probe bound by IVa2 (% bound) was calculated as described in the legend to Fig. 3.

