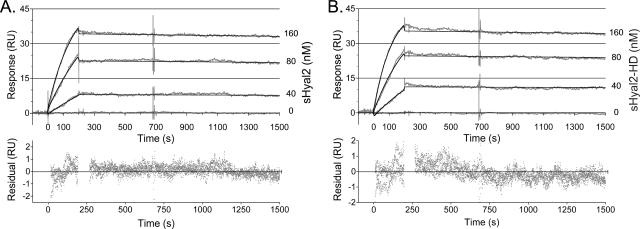
FIG. 5.
Kinetics of sHyal2 and sHyal2-HD binding to JSU-IgG. Reference-subtracted data (gray curves) illustrating the interaction between immobilized JSU-IgG and either sHyal2 (A) or sHyal2-HD (B) are shown, together with the corresponding fit (black curves) for several concentrations of analyte. Deviations of data from the proposed fit are shown below each panel in a residuals plot (gray dots). All data were analyzed and curve fits were generated using BIAevaluation software. RU, response units.

