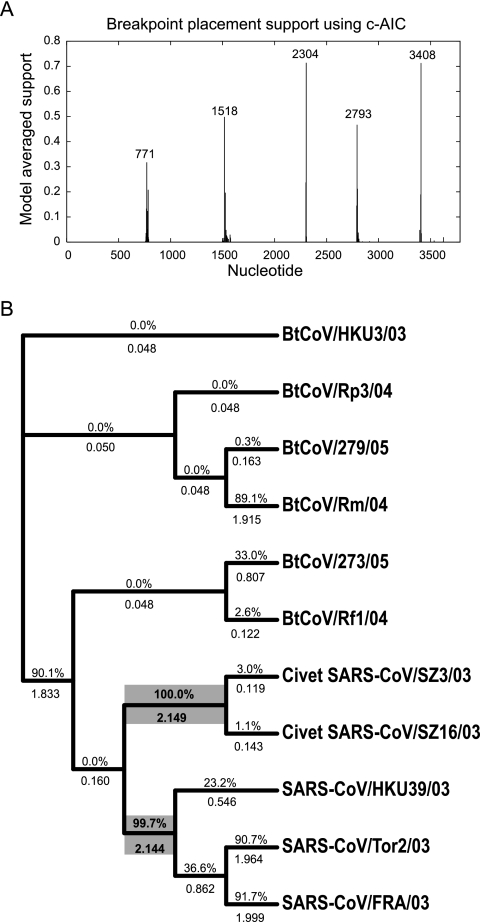
FIG. 3.
Detection of recombination (A) and lineage-specific selection pressure (B) on the spike genes of SARS-CoVs. Mean ω values calculated using GA are presented above branches, with ω values of >1 shown in bold. Numbers below branches indicate an averaged model probability of >1 along specific lineages. Branches with P values of ≥95% are highlighted in gray. The Akaike information criterion (c-AIC) for the best-fitting model was 23,557.

