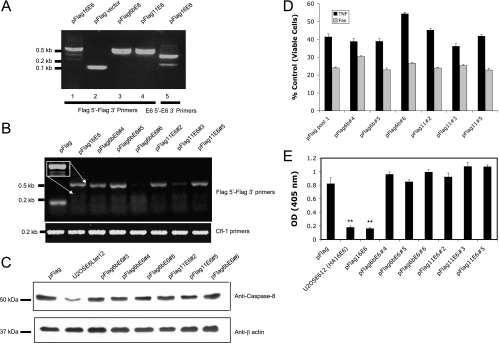
FIG. 9.
The low-risk types HPV-6b and -11 produce only the large isoform of E6, which does not affect the level of procaspase 8. (A) HPV-6b and -11 produce only the large isoform of E6. Expression of Flag-tagged E6 in stably transfected pools was analyzed by RT-PCR using primers for the vector (Flag 5′ and Flag 3′) (lanes 1 to 4). The presence of the splice variant for E6small/E6* was confirmed using primers 16E6 5′ and 16E63′ (lane 5). (B) Individual clones transfected with E6 from HPV-6b or -11 express the expected sequences at various levels. cDNA was prepared from RNA isolated from cells stably expressing HPV-16 E6, HPV-6b E6, and HPV-11 E6. RT-PCR was performed using primers for the vector (Flag 5′ and Flag 3′) (top). Normalization for loading was done using primers for cofilin (bottom). The inset shows an overexposure of the relevant area for cells transfected with pFlag16E6, demonstrating the presence of both the large and small transcripts. (C) The E6 proteins from the low-risk HPV-6b and -11 types do not decrease the level of endogenously expressed procaspase 8. Cells (2 × 10⁶) from each of the indicated cell lines expressing E6 were lysed in 100 μl Laemmeli buffer. The proteins were then separated by SDS-PAGE (20 μg/lane), and the level of endogenous procaspase 8 in each cell lysate was estimated by immunoblotting. For normalization, anti-β actin antibodies were used to detect the level of the protein. (D) The E6 proteins from HPV-6b and HPV-11 do not affect the cellular response to TNF or Fas. Each of the indicated cell lines was treated with TNF (5 ng/ml) in the presence of cycloheximide (5 μg/ml). After 16 h, cell viability was determined by the MTT assay and is presented as a percentage of viable cells, with cells untreated with TNF serving as the control. Each measurement was made in triplicate, and the error bars indicate the standard deviation of the mean. (E) The E6 proteins from HPV-6b and HPV-11 do not decrease cellular levels of p53. Isolated cell lines stably expressing the indicated versions of E6 (5 × 10⁴ cells per well in a 24-well plate) were untreated or treated with mitomycin C (2 μg/ml) for 16 h. The cells were then lysed with 100 μl of mammalian lysis buffer, and 50 μl of the lysate was subjected to a p53 ELISA (14). The relative level of p53 was estimated by absorbance at 405 nm, and the results are presented as the difference in absorbance between cells treated and untreated with mitomycin C. OD, optical density. Error bars represent standard deviations. **, 0.99 level of confidence.

