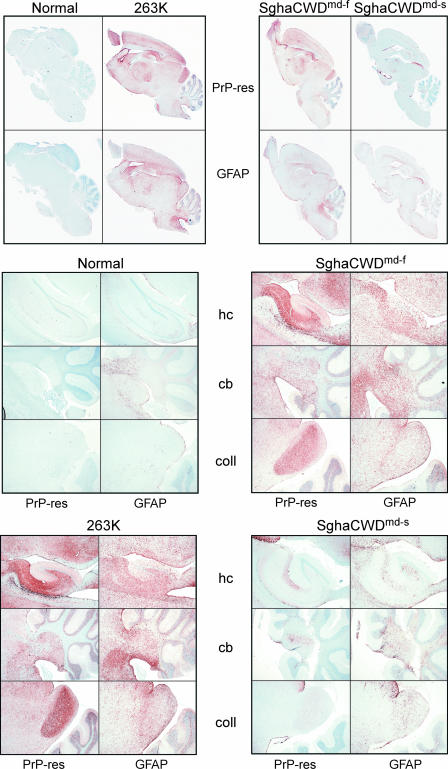
FIG. 5.
Immunohistochemical analysis of brain sections from slow (SghaCWDmd-s) and fast (SghaCWDmd-f) isolates compared to uninfected (normal) and 263K-infected Sg hamster brains. PrP-res deposition was visualized in sagittal sections of the various brains, using 3F4 Ab (“PrP-res” panels). Using adjacent brain sections, the extent of gliosis was visualized using anti-GFAP Ab (“GFAP” panels). Scanned whole-brain images are shown in the upper panels. For the middle and lower panels, hippocampus (hc), cerebellum (cb), and caudal colliculus (coll) regions were magnified at ×40 for more detailed analysis. The images shown are representative of the following numbers of brains analyzed: two normal brains, two 263K-infected brains, three each of second- and third-passage SghaCWDmd-f-infected brains, and two each of third-passage SghaCWDmd-s-, SghaCWDe-s-, and SghaCWDwd-s-infected brains.

