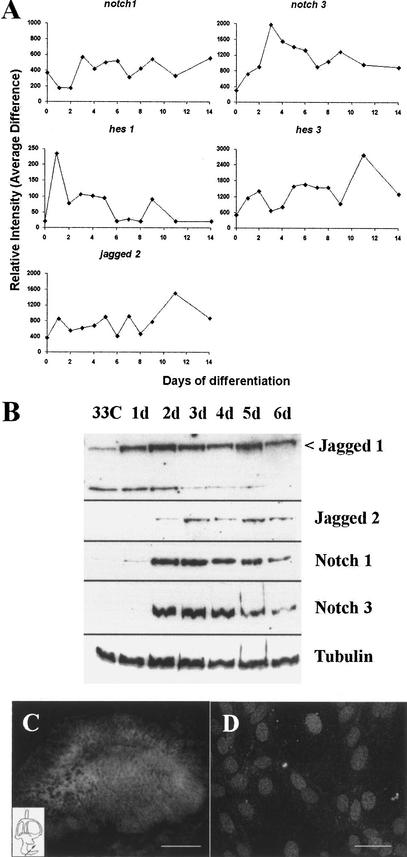
Figure 3.
Notch signaling cascade in UB/OC-1. (A) Relative gene chip expression for Notch1, Notch3, Jagged2, hes1, and hes3. (B) Western blot for notch and jagged proteins on protein samples taken at daily intervals. (C) Cross-section of an E14.5 cochlear duct, showing immunolabeling for Notch3. (D) UB/OC1 at 39°C for 3 d, showing nuclear location of Notch3. Bars are 50 μm.

