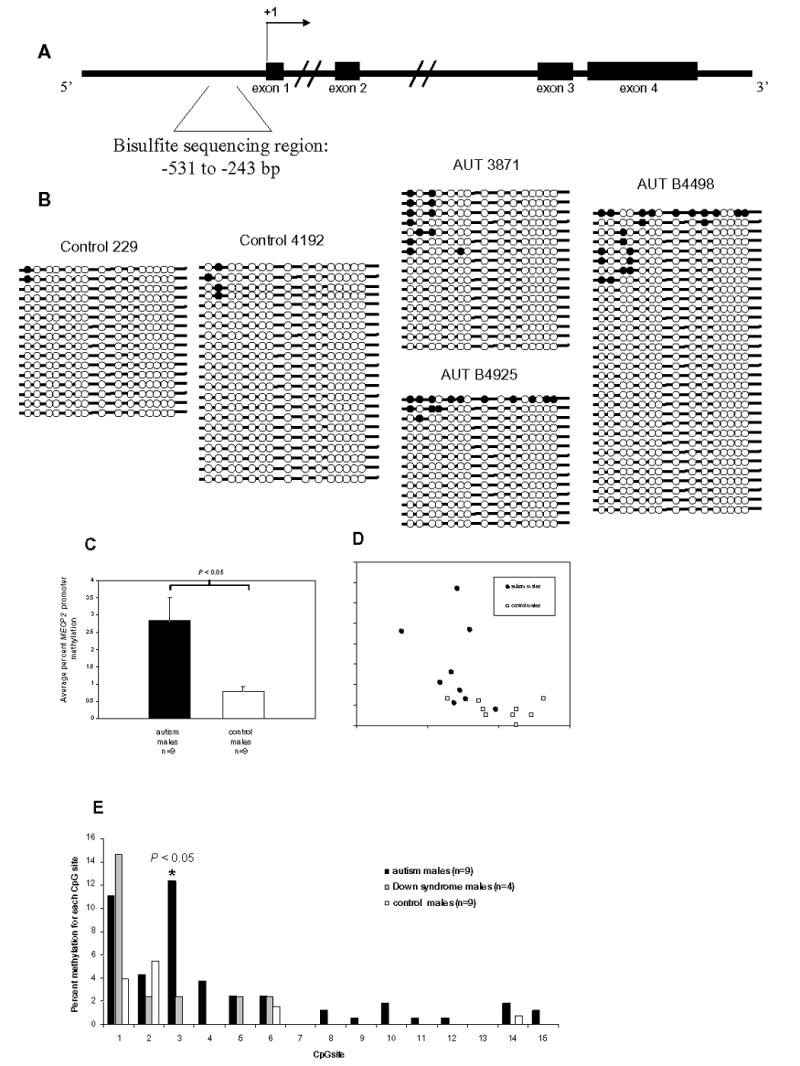
Figure 3.

Bisulfite sequencing analysis of MECP2 promoter methylation in frontal cortex DNA from autism and control postmortem brain samples. A. Schematic diagram of the MECP2 genomic region showing exons (filled rectangles), the transcription start site (+1), and the bisulfite sequencing region (bracketed sequence). B. Representative bisulfite sequencing data from two control males (229 and 4192) and three autism males (AUT 3871, AUT B4925, and AUT B4498). Each line with circles represents an individual clone. Filled circles indicate methylated CpG sites, and open circles indicate unmethylated CpG sites. A minimum of 10 clones were analyzed for each brain sample. All bisulfite data are shown in Supplementary Figure I. C. Percent MECP2 methylation for autism (n=9), and control (n=9) males was calculated by dividing the number of methylated CpG sites by the total number of CpG sites assayed for each brain sample. Results are graphed as mean ± SEM, and significance was determined by t-test. A statistically significant difference between autism and controls was also observed by analyzing the percentage of clones with one or more methylated sites out of the total number of clones for each sample (data not shown) D. Scatterplot showing percent MECP2 methylation and normalized MeCP2 expression for each brain sample. Autism samples are shown as filled circles and controls are shown as open squares. Regression was calculated for autism and controls together (R2=0.3235, P<0.05), as well as for autism (R2=0.1334) and control(R2=0.1065) samples alone. E. The percent methylation for each CpG site was compared between autism (n=9), Down syndrome (n=4), and control (n=9) males. CpG sites are shown on the x axis as in B. CpG site #3 showed a significant increase (P=0.0031, t-test) in autism vs. controls.
