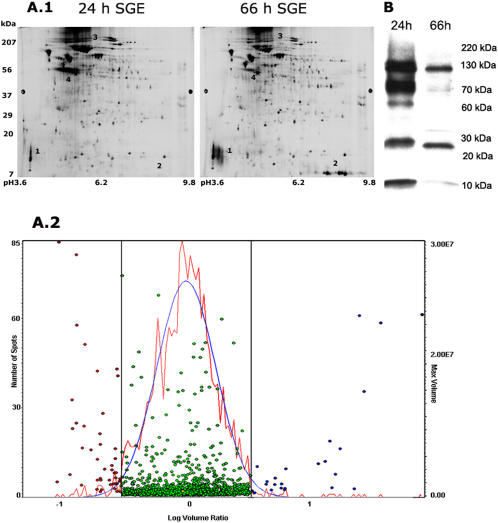
Figure 1. Proteome profile of 24 h and 66 h fed salivary glands.
A.1. Differential 2D Fluorescence Gel Electrophoresis (DIGE) of 50 µg of proteins from 24 and 66 h fed salivary glands. Highlighted are proteins at positions 1 and 2 preferentially expressed at 66 h, while proteins at positions 3 and 4 are differentially expressed in 24 h salivary glands. A.2. Histogram of the global protein profiles plotted as a log ratio of spot intensity of Cy5/Cy3 (66 h/24 h) shows a set of proteins that are greater than 3 fold differentially expressed in 24 h (indicated by red circles) and 66 h (indicated by blue circles). Proteins less than 3 fold differentially expressed (indicated by green circles) are represented within the bell curve. B. A western blot of 5 µg of proteins isolated from 24 and 66 h fed salivary gland extracts probed with nymph-immune rabbit serum shows greater reactivity with proteins from the 24 h extracts than from the 66 h fed extracts.

