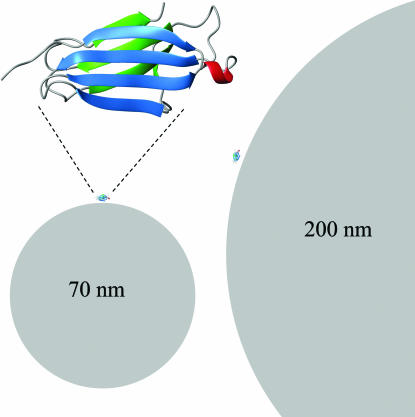
Fig. 1.
Size comparison of monomeric β2m (see Upper Left for enlargement) with nanoparticles. One protein molecule is placed on each particle in scale for size comparison with nanoparticles of 70 nm (Lower Left) and 200 nm (Right). This figure was prepared with Molmol (58).

