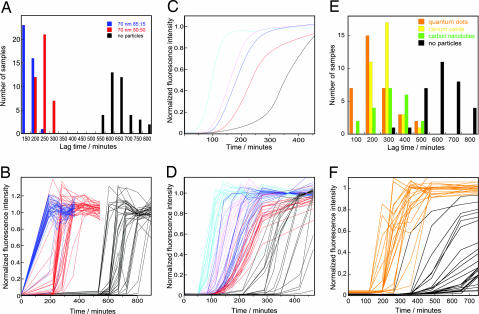
Fig. 3.
Kinetics of β2m fibrillation. (A and E) Histograms of observed lag times. (B, D, and F) Thioflavin T fluorescence as a function of time showing kinetic traces for all samples in each group. (C) The average of all samples of each kind shown in D. (A and B) Forty micromolar β2m at 37°C in 20 mM sodium phosphate buffer, pH 2.5, with 50 mM NaCl and 0.02% NaN3. (C and D) Forty micromolar β2m at 37°C in 20 mM sodium phosphate buffer, pH 2.5, with 40 mM NaCl and 0.02% NaN3. (E and F) Forty micromolar β2m at 37°C in 20 mM sodium phosphate buffer, pH 2.5, with 50 mM NaCl and 0.02% NaN3. Color coding of kinetic traces and histograms: blue (0.01 mg/ml 70-nm 85:15 NIPAM/BAM particles), cyan (0.01 mg/ml 200-nm 85:15 NIPAM/BAM particles), red (0.01 mg/ml 70-nm 50:50 NIPAM/BAM particles), pink (0.01 mg/ml 200-nm 50:50 NIPAM/BAM particles), orange (100 nM 16-nm quantum dots), green (≤0.01 mg/ml 6-nm-diameter multiwalled carbon nanotubes), yellow (≤0.01 mg/ml 16-nm cerium oxide particles), and black (samples without particles).

