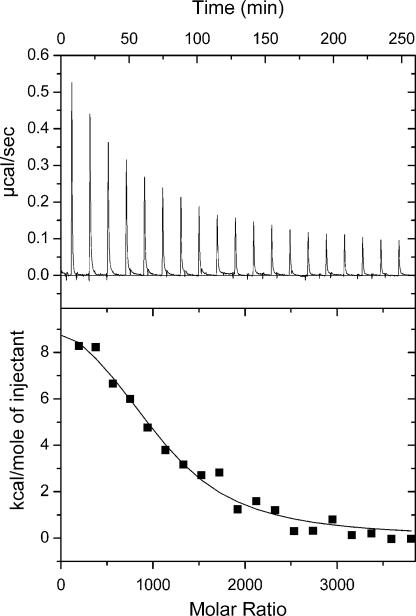
Fig. 6.
Isothermal titration calorimetry data at 5°C from titration of β2m into a solution containing 70-nm 50:50 NIPAM/BAM nanoparticles. The protein concentration was 160 μM, and the particle concentration was 1 mg/ml. Each injection was 15 μl with a total of 19 injections. (Upper) Raw data. (Lower) integrated data. The black line shows the fitted curve assuming a simple 1:1 binding model with one kind of sites (Eq. 3 in SI Text), with the parameter values ΔH = 45 kJ/mol and KA = 4 × 10⁵ M−1, n = 1,040.

