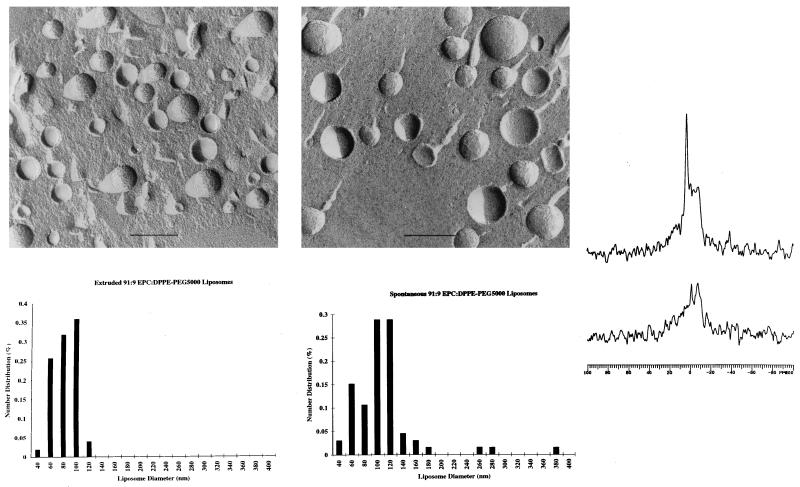
Figure 4.
Freeze-fracture electron micrographs of 9:1 EPC/DPPE-PEG5000 dispersions. All liposome samples were cryoprotected with 20% (vol/vol) glycerol before freezing in liquid nitrogen. Samples were fractured at −196°C, shadowed at 45° with platinum, and at 90° with carbon before digesting in bleach solution. Replicas were rinsed in distilled water and dried before visualization with a Phillips CM-12 microscope operating at 60 kV. Magnification calibrations were performed by using a carbon waffle grid. (A) (Upper) Extruded (34) at 30°C. (Lower) Distribution of observed liposome diameters as determined by analysis of electron micrographs. (B) (Upper) Vortexed at 23°C. (Lower) Distribution of observed liposome diameters as determined by analysis of electron micrographs. (C) 31P NMR of spontaneous 9:1 EPC/DPPE-PEG5000 liposome dispersions without (Upper) and with (Lower) extraliposomal Mn2+. NMR spectra were acquired at 81 MHz by using a 90° pulse width, with decoupling gated on during acquisition (off during the 3.16-s delay), on 5-mm samples. The appearance of the powder pattern component in the composite 31P lineshape is in part because of sample viscosity effects (39).

