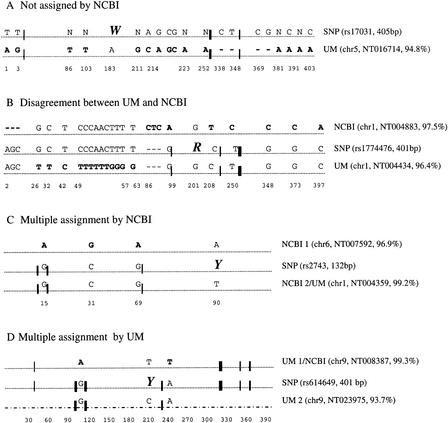
Figure 4.
Four examples of different assignments made using the UM and NCBI methods. The information in parentheses is the ID and length of the SNP sequences, chromosome number, contig number, and percent identity to the SNP sequence for the UM- or NCBI-matched genomic sequence. BLAST was used to align these sequences. Mismatches in the alignment are indicated above the dotted line; those differing from the SNP sequence are shown in bold type. The exception is the last sequence (UM 2 in case (D), which contains too many (29) mismatches for them to be clearly labeled; this sequence is therefore shown as a broken line. The SNP site is shown by a large italicized letter. UMs, represented by vertical lines of varying thickness to roughly indicate their amount, are shown on the sequence at the approximate locations. For example, in case (A), 10 UMs are shared by the SNP sequence and the UM-assigned genomic sequence, and of these, seven are found in a small region between 302 bp and 327 bp. In cases (B) and (C), 19 and 8 UMs are shared, respectively. In case (D), the UM assignments (UM 1 and UM 2) both shared 11 UMs with the SNP sequence but at different locations.

