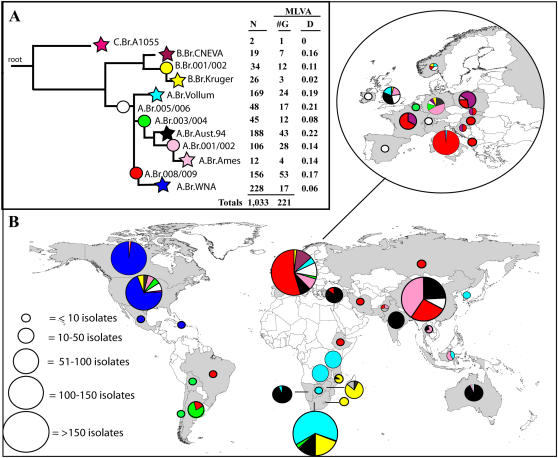
Figure 3. Worldwide distribution of B. anthracis clonal lineages:Phylogenetic and geographic relationships among 1,033 B. anthracis isolates.
(A) Population structure based upon analysis of data from 12 canSNP (Protocol S1). The numbers of isolates (N) and associated MLVA genotypes (G) within each sub-lineage are indicated as well as the average Hamming distance (D) as estimated from VNTR data. The major lineages (A, B, C) are labelled, as are the derived sub-lineages (1–12), which are also color-coded. (B) Frequency and geographic distribution of the B. anthracis sub-lineages. The colors represented in the pie charts correspond to the sub-lineage color designations in panel A.

