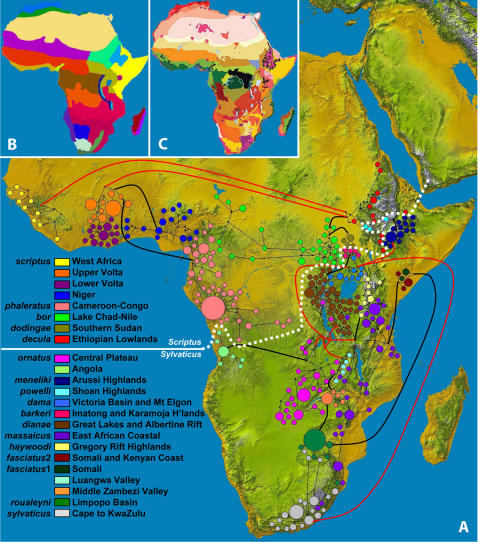
Figure 1. Pan-African relationships among 23 bushbuck haplogroups in relation to toplogy and habitat heterogeneity.
Part A. An unrooted median joining network of 485 control region sequences, overlaid onto a topographical map of Africa. 320 haplotypes are arranged according to original sampling location, thus describing the approximate geographic range of each terminal haplogroup. The size of each circle is scaled to haplotype frequency. A dashed white line separates Scriptus and Sylvaticus haplotypes. Relationships between intermediate-level haplogroups (thick red links) were unresolved by CR data and were inferred from a cytochrome b network (data not shown). Thick black links join terminal haplogroups nested within intermediate haplogroups and thin black links join individual haplotypes within terminal haplogroups. Inset panels B and C show the comparitive distribution of biogeographic provinces [3] and ecoregions [7] respectively.

