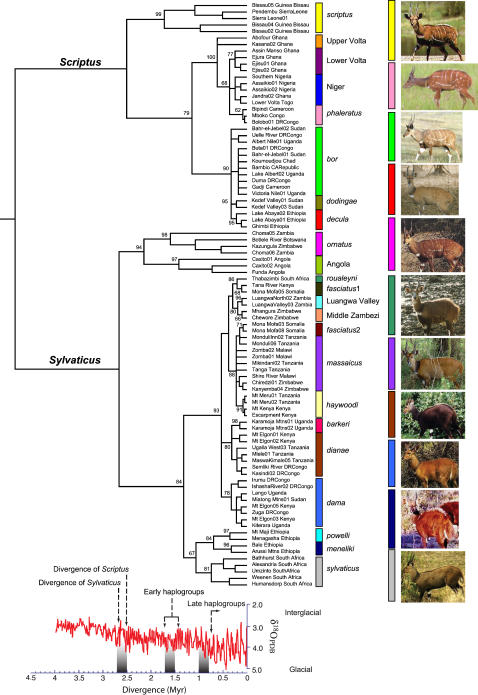
Figure 2. Linearised phylogenetic tree for 90 cytochrome b haplotypes obtained by maximum likelihood assuming an HKY model for nucleotide substitution.
Nodal support for haplogroups is displayed and nodes with less than 50% support were collapsed. Haplogroups are determined by monophyly and distribution. Haplogroups are colour coded as in Figure 1. The picture panel shows the general phenotype of each intermediate-level haplogroup. The decula terminal haplogroup is depicted to show the loss of patterning in this subspecies. The bottom panel displays the timing of evolutionary events with equivalent changes in the global temperature (as measured by changes in the oxygen isotope 18) adapted from [55].

