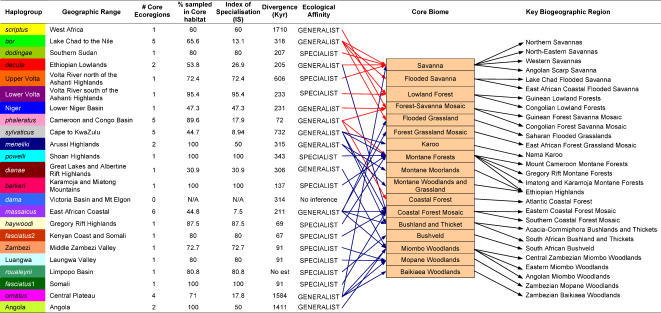
Figure 3. Ecoregional habitation of 23 bushbuck haplogroups, the inference of ecological affinities and the identification of key biogeographic regions as defined by molecular data.
Ecological affinity was inferred from a haplogroup's index of specialisation (IS); Arrows (red for the Scriptus group and blue for the Sylvaticus group) summarise the core ecoregions of each haplogroup into their appropriate core biomes (shaded), which were then translated into key biogeographic regions by the inclusion of geography. Haplogroups are colour-coded as in Figure 1.

