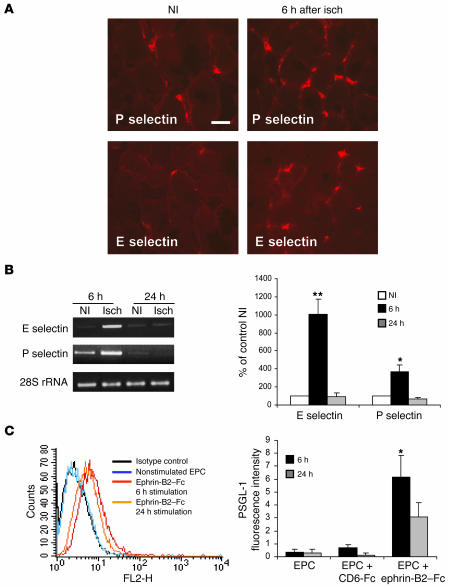
Figure 8. Time-dependent expression of selectins and PSGL-1.
(A) Representative photomicrographs of ischemic (6 hours) and nonischemic gastrocnemius muscle sections stained with rat anti-mouse E selectin or P selectin. Positive staining (red) is localized in blood vessels between the muscle fibers. Scale bar: 40 μm. (B) RT-PCR analysis of E selectin and P selectin mRNA expression in ischemic muscles 6 hours or 24 hours after the onset of ischemia and in nonischemic muscles at the same time intervals. Data were normalized for loading with 28S RNA. n = 3. *P < 0.05; **P < 0.01 versus nonischemic muscle. (C) PSGL-1 expression on EPCs following ephrin-B2–Fc stimulation. EPCs were stimulated with ephrin-B2–Fc for 6 hours or 24 hours and then processed for FACS analysis of PSGL-1 expression. FACS profiles are shown in the left panel, and quantification of PSGL-1 expression in the right panel. n = 3. *P < 0.05 versus EPCs.

