
Figure 5. UCM results across subjects.
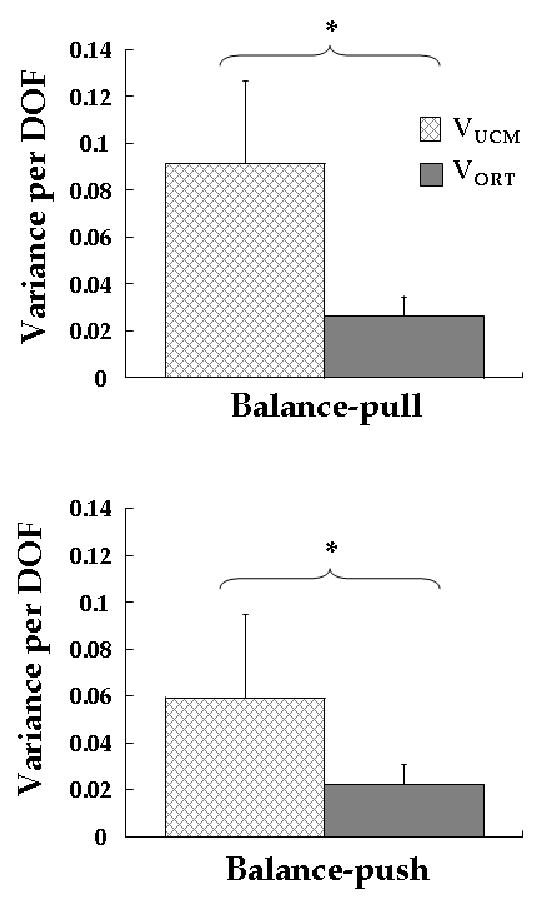
Variance within the UCM (VUCM) and orthogonal to the UCM (VORT) per degree of freedom averaged across subjects. The top and bottom panels show results for the Balance-pull and Balance-push conditions respectively. Results are collapsed across analysis on M-modes and Jacobians from Step-push and Step-pull. Significant differences between VUCM and VORT are indicated by * (p < 0.05).