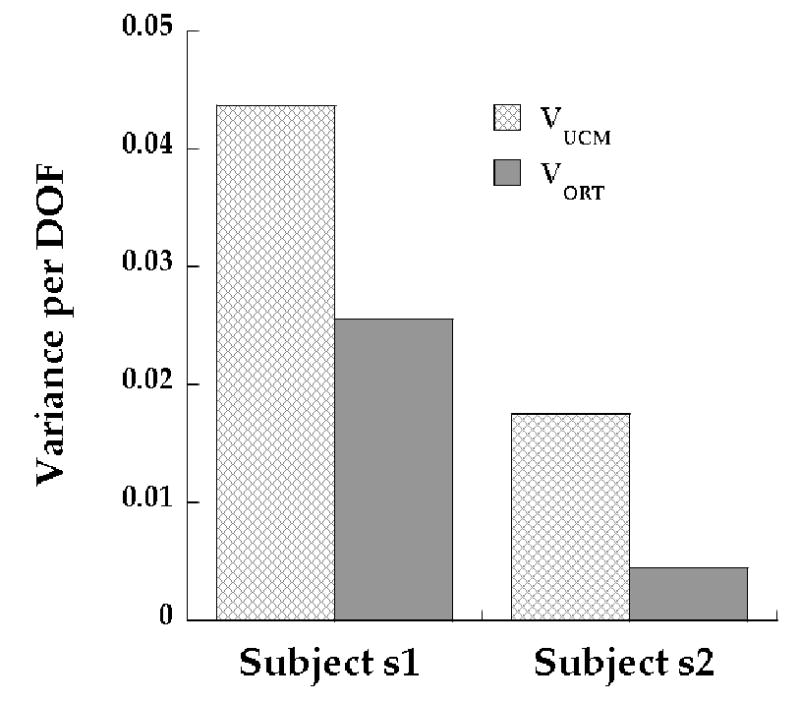
Figure 6. UCM results in individual representative subjects.

Variance within the UCM (VUCM) and orthogonal to the UCM (VORT) per degree of freedom are shown in subjects s1 (left bars) and s2 (right bars) respectively. Results for the Balance-pull task using M-modes and Jacobians from Step-push are shown. Note the high values of VUCM compared to VORT in both subjects. Corresponding M-modes for the two subjects are shown in Table 1a (s1) and Table 3 (s2).
