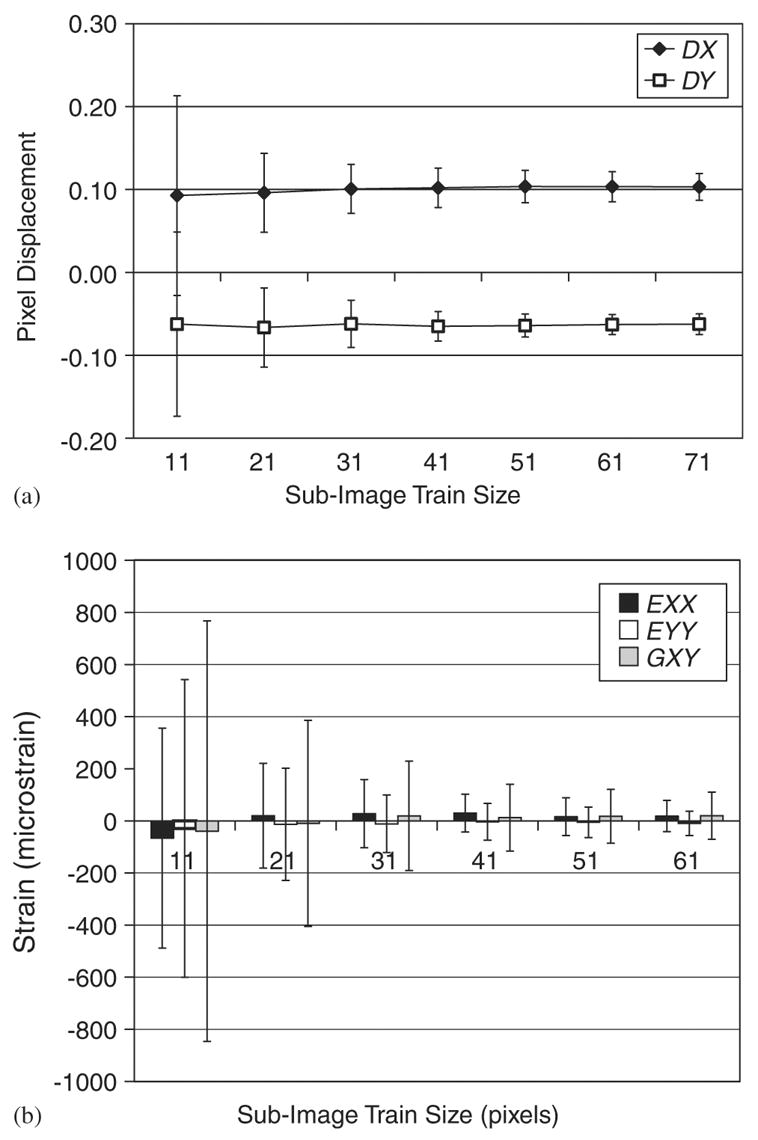
Fig. 3.

An image correlation parameter convergence analysis was performed using a measurement grid of 24 × 18 on two successive images of an unloaded specimen. The mean and standard deviation of the measured displacements in the x direction (DX) and y direction (DY) and the two-dimensional strain tensor (EXX, EYY GXY) for all measurements points on the image (432 grid points) were calculated for each successively increasing sub-image train size. The sub-image train template size converged to 61 × 61 pixels for both the in-plane displacements (3a) and the two-dimensional strain tensor (3b). Data plotted are mean values ± standard deviation.
