
Figure 1.
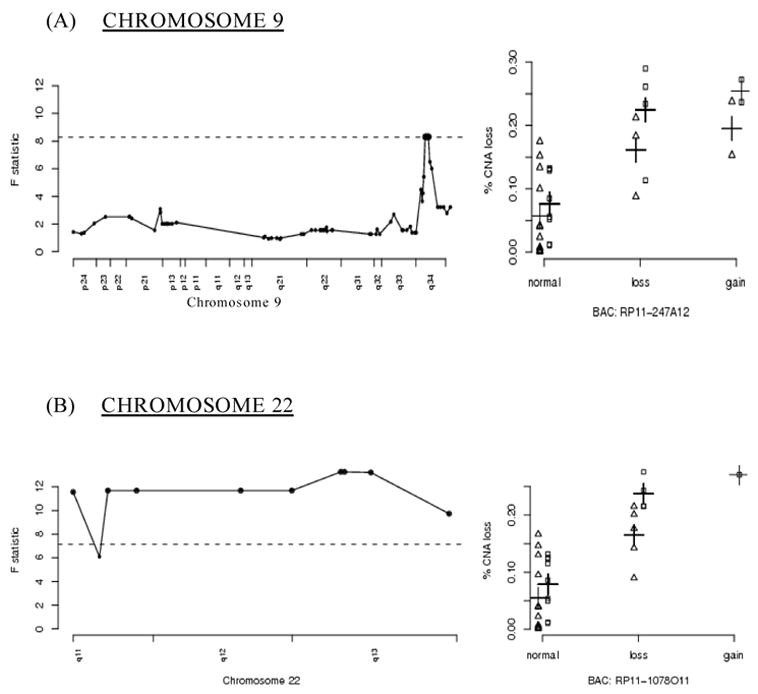
A graphical representation of significant BACs located on chromosomes 9 and 22 The x-axes for figures located in the left column represent the genomic location of BACs in that particular chromosome; the y-axes for these figures correspond to the F-statistic values for the overall model The x-axes for the figures located in the right column represent the relative copy number state of the identified BACs; the y-axes for these figures correspond to the estimated rates of overall copy number aberration (% CNA) on the balance of the genome Horizontal dashed lines correspond to the empirical 95% thresholds; highlighted points correspond to statistically significant BACs The BACs in the right-hand columns are representative of the significant regions of the corresponding chromosomes to their left (e.g. RP11-247A12 for chromosome 9q34) Points in the right hand column are offset according to smoking status: non-smokers (Δ) and smokers ([]) The crosses (+) indicate the fitted means.