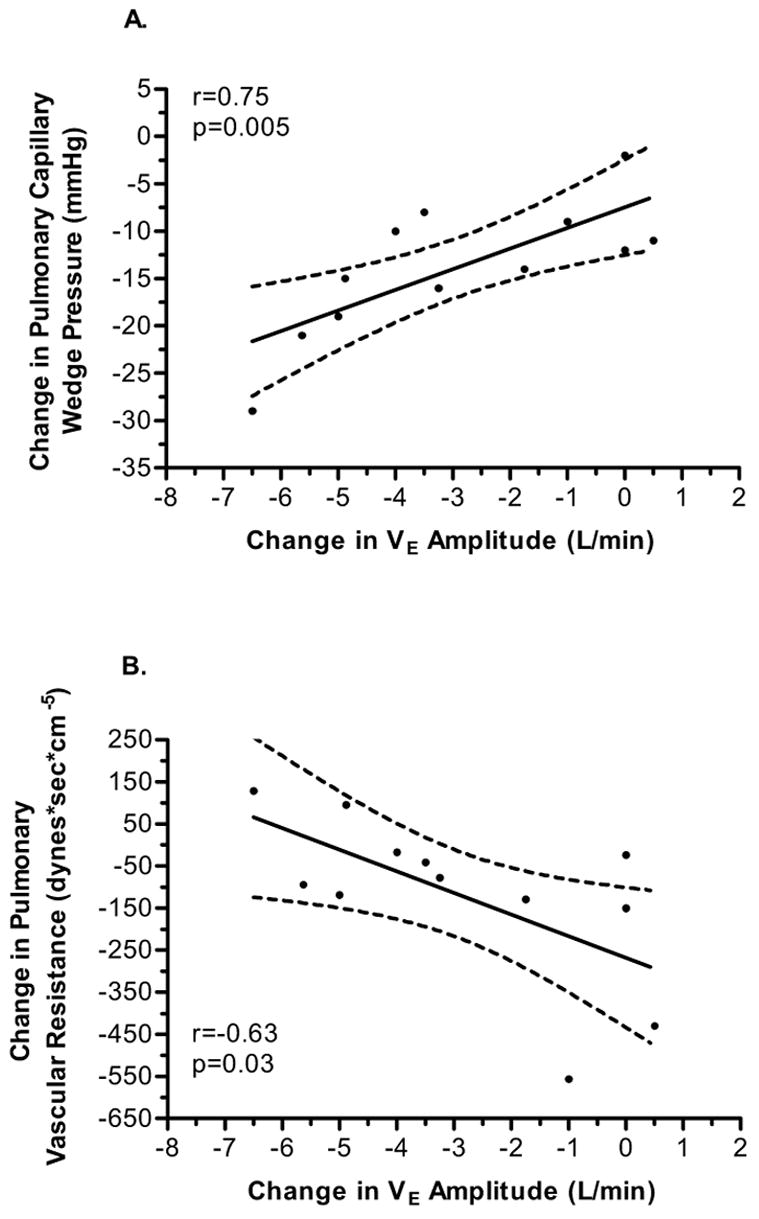
FIGURE 1.

A. Correlation between the change in mean pulmonary wedge pressure and amplitude of minute ventilation oscillations. The solid line represents the least square regression line and the dashed lines represent the 95% confidence interval of the regression line. B. Correlation between the change in pulmonary vascular resistance and amplitude of minute ventilation oscillations. The solid line represents the least square regression line and the dashed lines represent the 95% confidence interval of the regression line.
