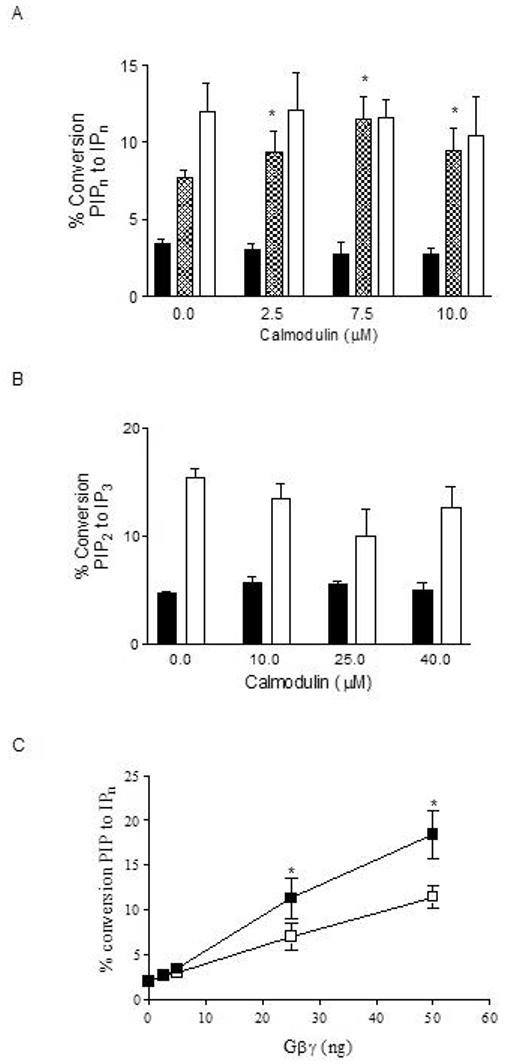
Figure 2.

Effect of calmodulin on basal and G-protein-stimulated PLCβ activity in vitro. (A) Basal (solid bars), 50 ng (90 nM) Gβγ-stimulated- (hatched bars), and 30 ng (70 nM) GTPγSGαq-stimulated (white bars) PLCβ3 activity was quantitated in the presence of increasing concentrations of calmodulin. (B) Basal (solid bars) and 30 ng GTPγS-Gαq-stimulated (white bars) PLCβ1 activity was quantitated in the presence of increasing concentrations of calmodulin. Basal PLCβ activity was measured using PIP2 substrate in detergent/phospholipid vesicles. G-protein-stimulated PLCβ activity was measured in the presence of purified G protein subunits using PIP2 substrate in detergent/phospholipid vesicles. PLCβ activity was quantitated as percent conversion of [3H]PIP2 substrate to [3H]IPn (derivatives of inositol phosphate with the individual phosphate positions defined in accordance with the IUPAC convention) as described in Methods. (C) PLCβ3 activity was measured in the presence of increasing concentrations of Gβγ subunits with (■) or without (□) 10 μM calmodulin. Data shown are mean ± SEM of 3 to 5 separate experiments performed in triplicate. Asterisk (*) indicates treatment results significantly different from vehicle at p < 0.001.
