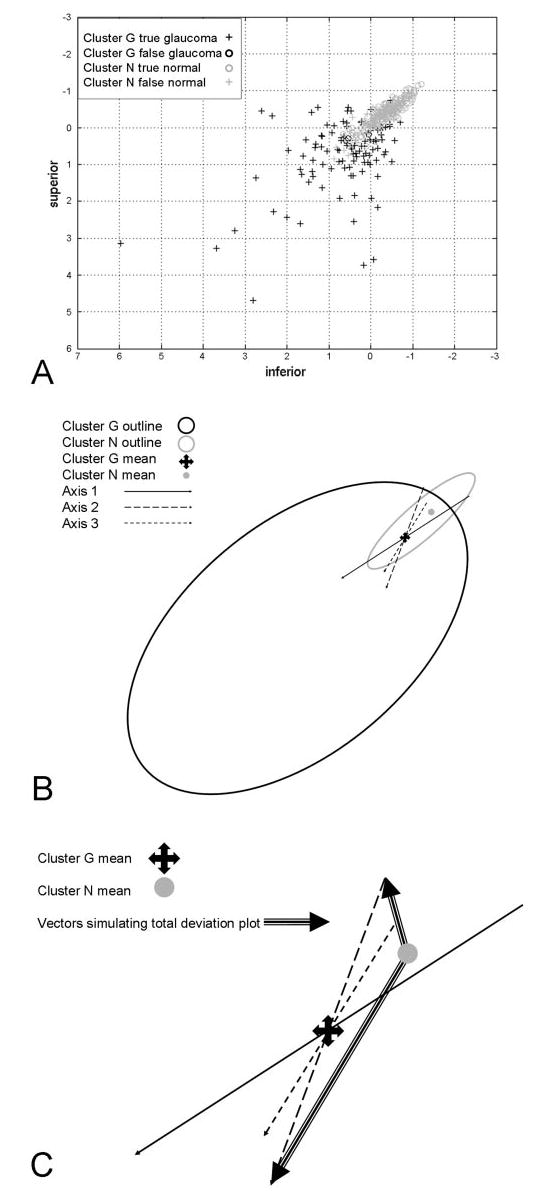
Figure 1.

(A) Two-dimensional scatterplot of participants with (+) and without (○) GON. Units are in standard deviations away from the mean of cluster G. (B) Two-dimensional projection of 53-dimensional space. vB-ICA-mm converged to two clusters: named from post hoc analysis the glaucoma cluster (cluster G) and normal cluster (cluster N). The glaucoma cluster decomposed into six axes through the glaucoma mean. Axes 1 to 3 are shown; axes 4 to 6 are not depicted, to avoid cluttering. The positive direction of each axis moves farther from the normal mean. (C) Relationship of points on axes in cluster G to the mean of the normal cluster. Large arrows: vectors from the cluster N mean to a point on the negative side and a point on the positive side of axis 2. Grayscales at the tips of these vectors simulate the grayscale of TD plots. Increasing severity away from the normal mean most closely matches increasing deviation from the glaucoma mean on the positive side of the glaucoma mean.
