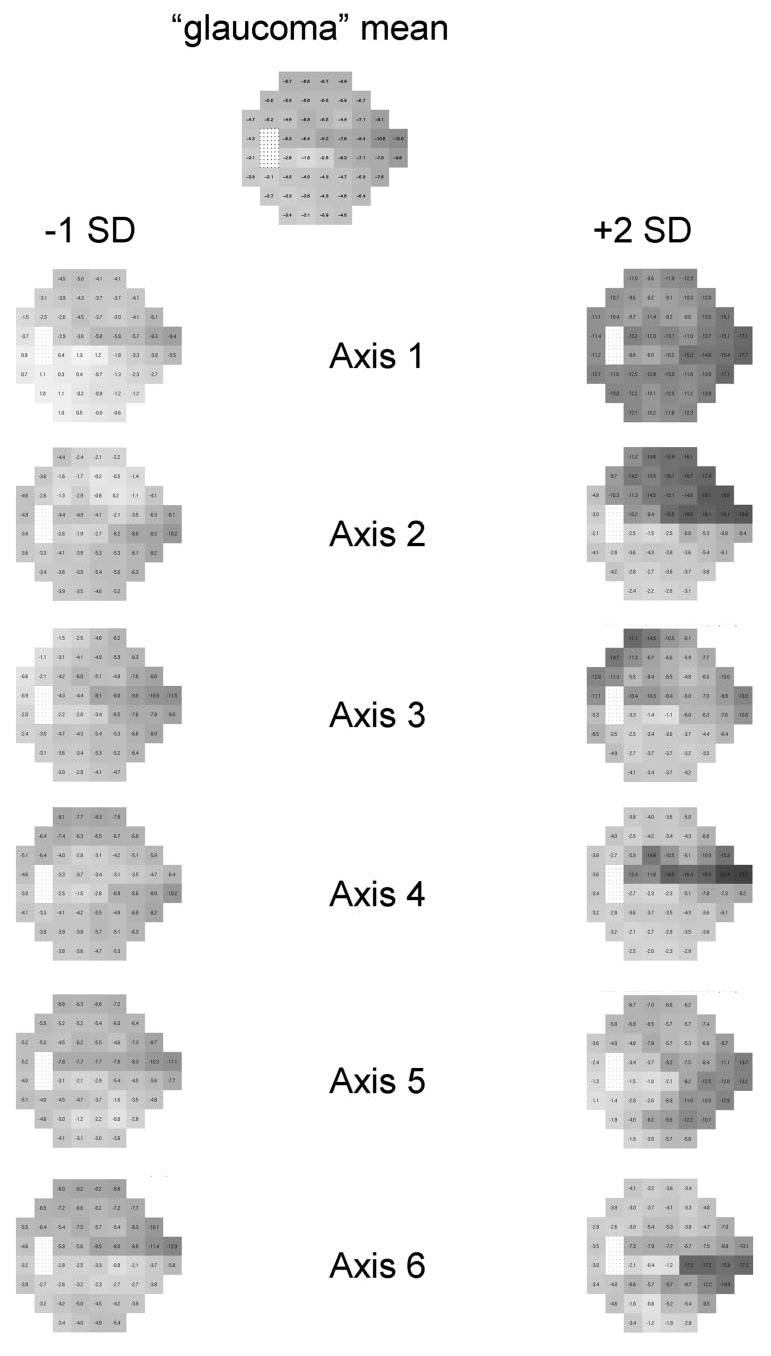
Figure 4.

Generated patterns on axes. Patterns generated at cluster G (mostly GON) mean, −1 SD on each axis in cluster G, and +2 SD on each axis in cluster G, with the plots displayed as if they were gray-scale images of TD plots of the left eye.

Generated patterns on axes. Patterns generated at cluster G (mostly GON) mean, −1 SD on each axis in cluster G, and +2 SD on each axis in cluster G, with the plots displayed as if they were gray-scale images of TD plots of the left eye.