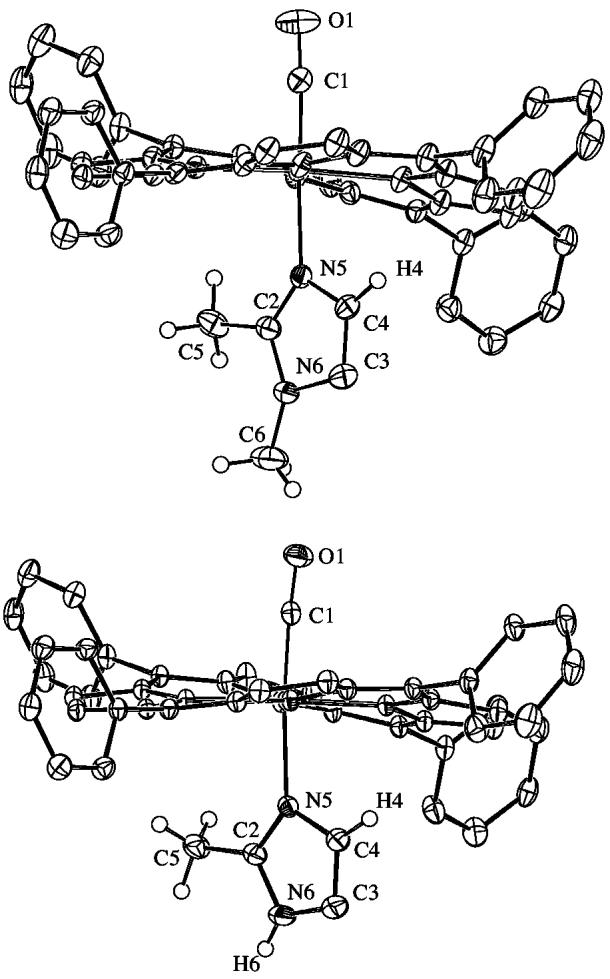
Figure 1.

ORTEP diagrams (50% probability ellipsoids) of (top) [Fe(TPP)(CO)(1,2-Me2Im)]·C7H8 (only the major orientation of imidazole shown) and (bottom) [Fe(TPP)(CO)(2-MeHIm)]·C7H8. Significant hydrogen atoms are displayed; all other hydrogen atoms are omitted for clarity. Note the tilt of Fe–NIm off the heme normal and the near linearity of the Fe–C–O group.
