
Figure 9.
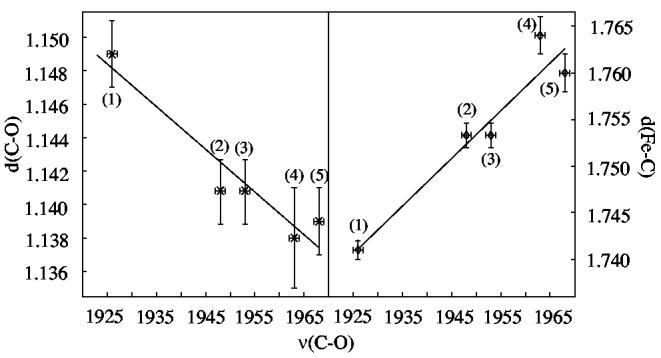
Plots showing the relationship between the Fe–C and C–O distances (Å) and νC–O (cm−1). The two panels show data for: (1) [Fe(TPP)(CO)(2-MeHIm)]·C7H8, (2) [Fe(TPP)(CO)(1,2-Me2Im)]·C7H8, (3) [Fe(TPP)(CO)(1,2-Me2Im)]·C7H8 (second νC–O), (4) [Fe(TPP)(CO)(1,2-Me2Im)], and (5) [Fe(TPP)(CO)(1-MeIm)]·C6H6. Error bars are displayed. Correlation coefficients for both panels are R = 0.96. 93 A plot including all iron(II)carbonyl imidazoles is included in the Supporting Information.