
Figure 1.
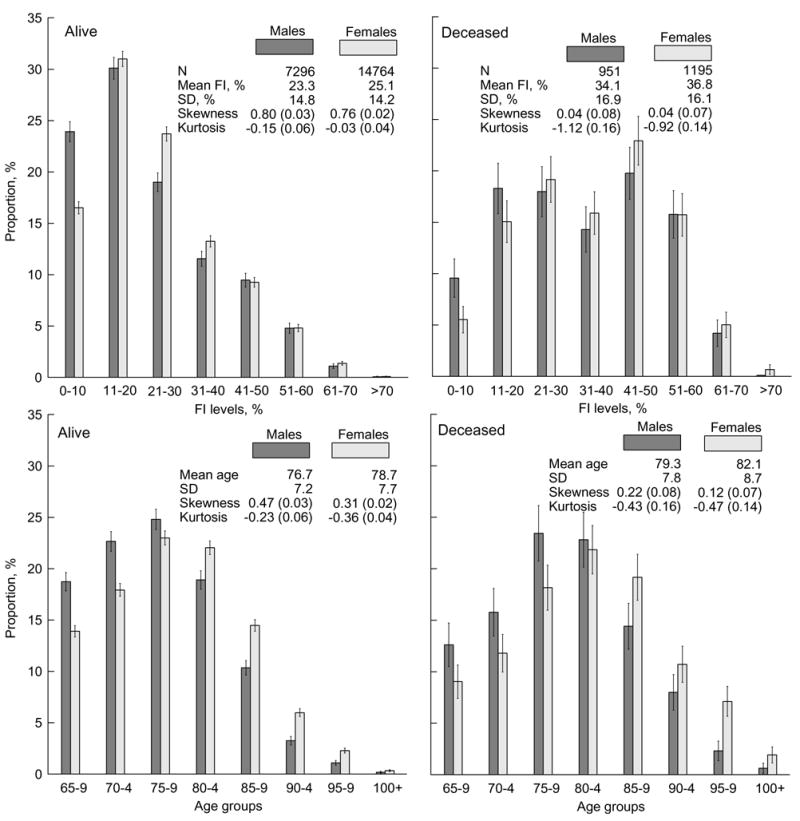
Frailty index (FI) (upper panels) and age (lower panels) frequency patterns for males and females surviving (left panels) and dying (right panels) during one year after the date of the respective interview. Thin bars show 95% confidence interval (CI). Insets show characteristics of the population marginal distributions. Numbers in parentheses are standard errors. SD means standard deviation.