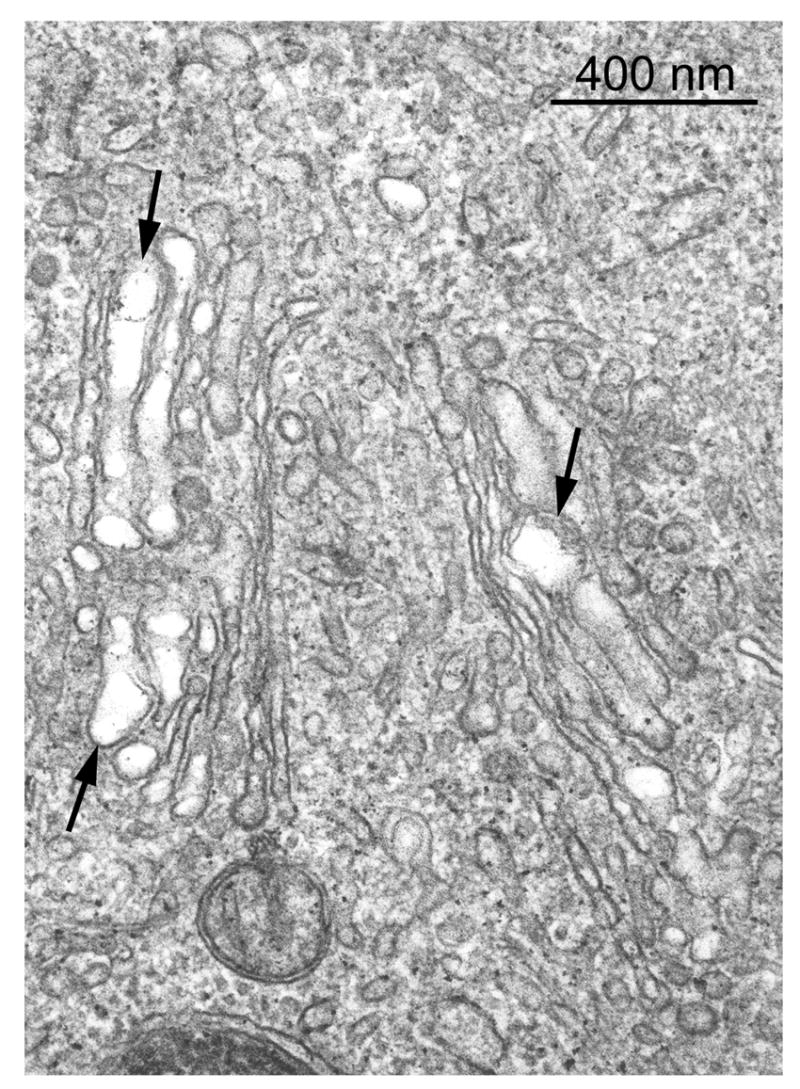
Figure 5.

Electron micrograph of a BEC from a rat liver 3 h after 25 mg DAPM/kg. Regularly spaced cisternae of the Golgi region are replaced by dilated cisternae that show areas of membrane coalescence or disruption (arrows). Original magnification; 82,500X.
